
Skeletal Phenotyping Protocol
Tissue Volume
Click image to enlarge.
BIOQUANT has several unique tools to help you define the Tissue Volume quickly and consistently.
Irregular TV Tool
The Irregular Region of Interest tool helps you define the trabecular compartment as a shape that is a constant distance from the cortical shell and growth plate.
Rectangular TV Tool
The Rectangular TV tool creates a rectangular TV of specific dimensions, positioned a fixed distance from the growth plate.
Automated Bone Detection by Color Threshold
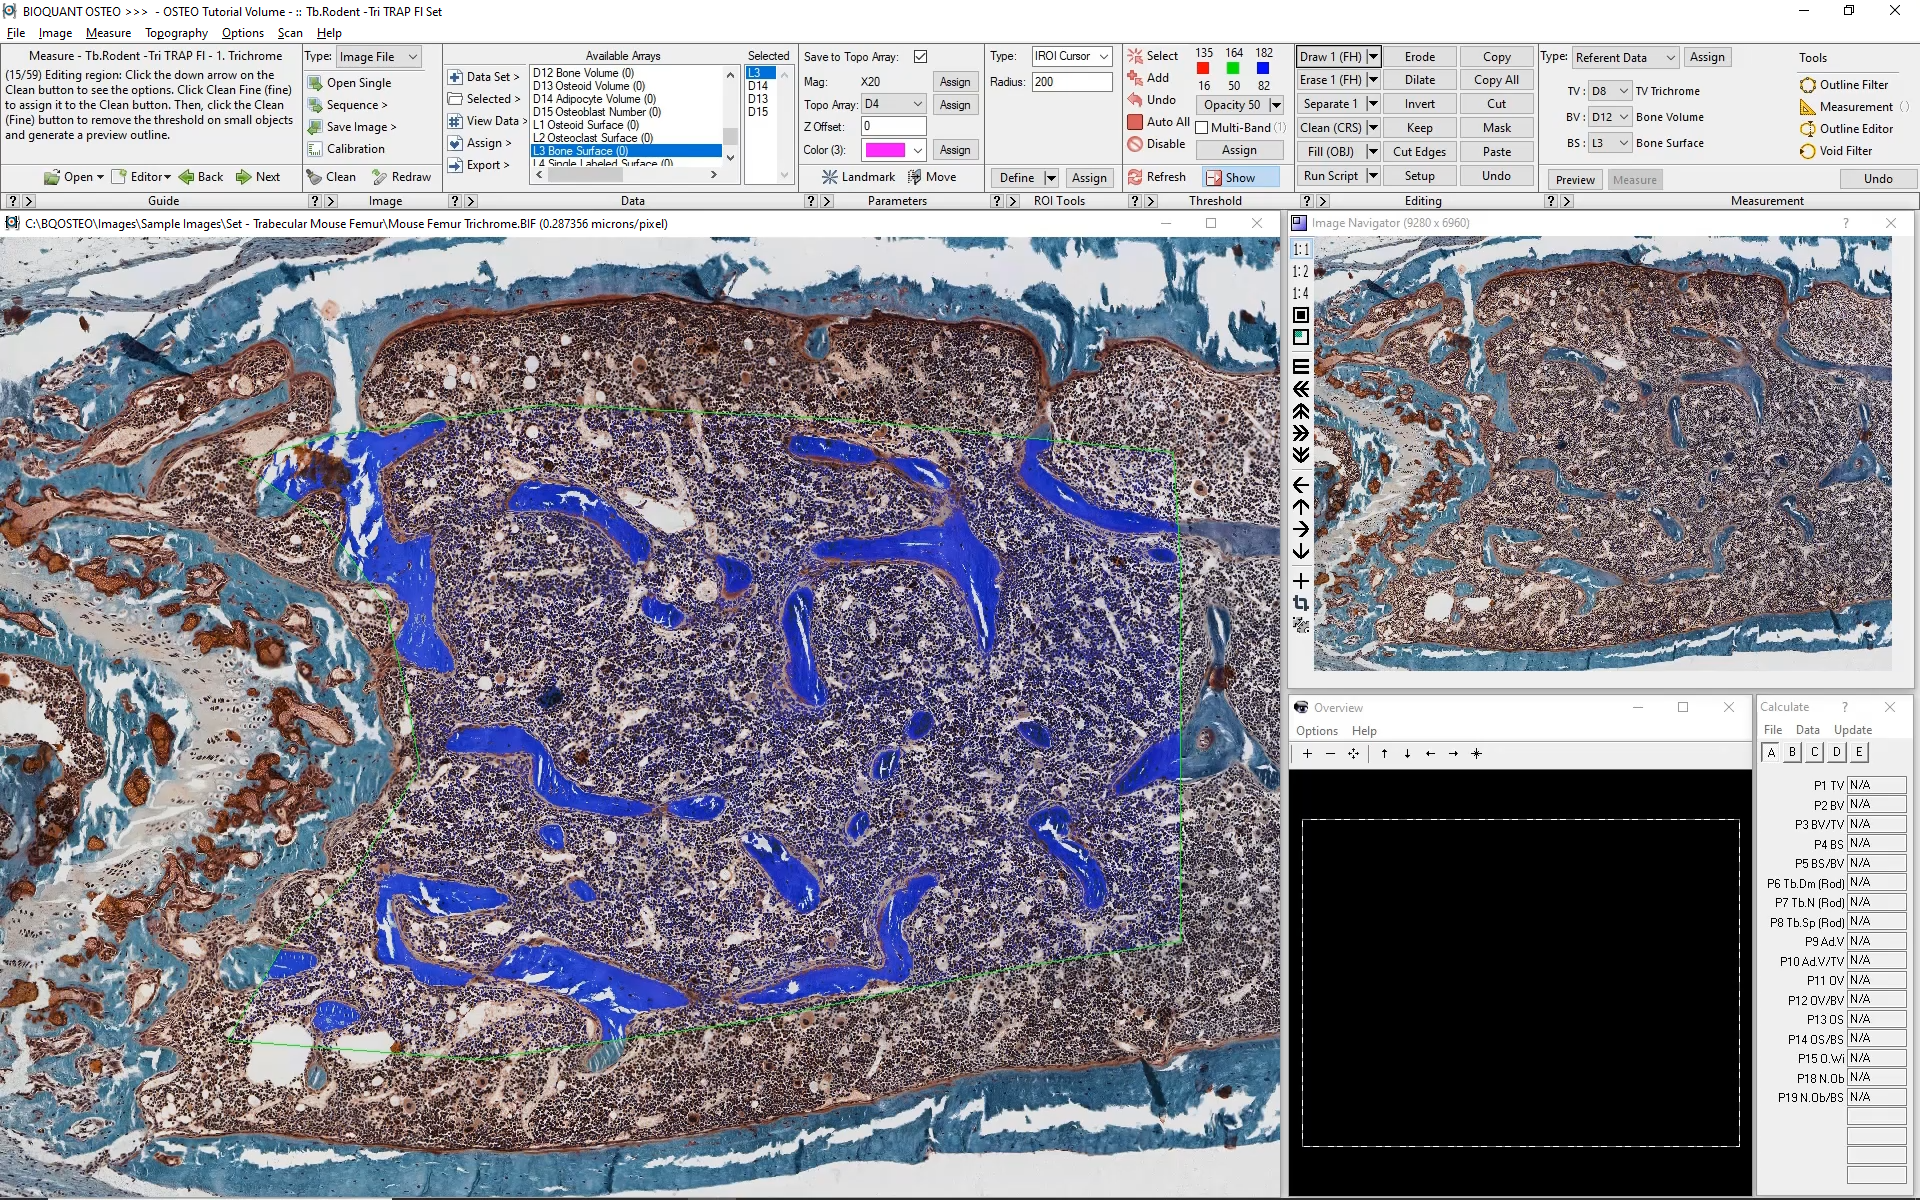

Automatic Thresholding
BIOQUANT uses the specific coloring created by stains to identify different biological structures. For example, in the images above, the blue color is associated with mineralized bone. The red color is associated with osteoid. The dark red to black color is associated with the marrow.
Clicking once on a color and scrolling the mouse wheel up and down automatically selects a range of colors associated with the structure. These color ranges can be saved and retrieved automatically by the software when different data should be collected. For example, selecting the Bone Surface array automatically retrieves the threshold associated with bone.
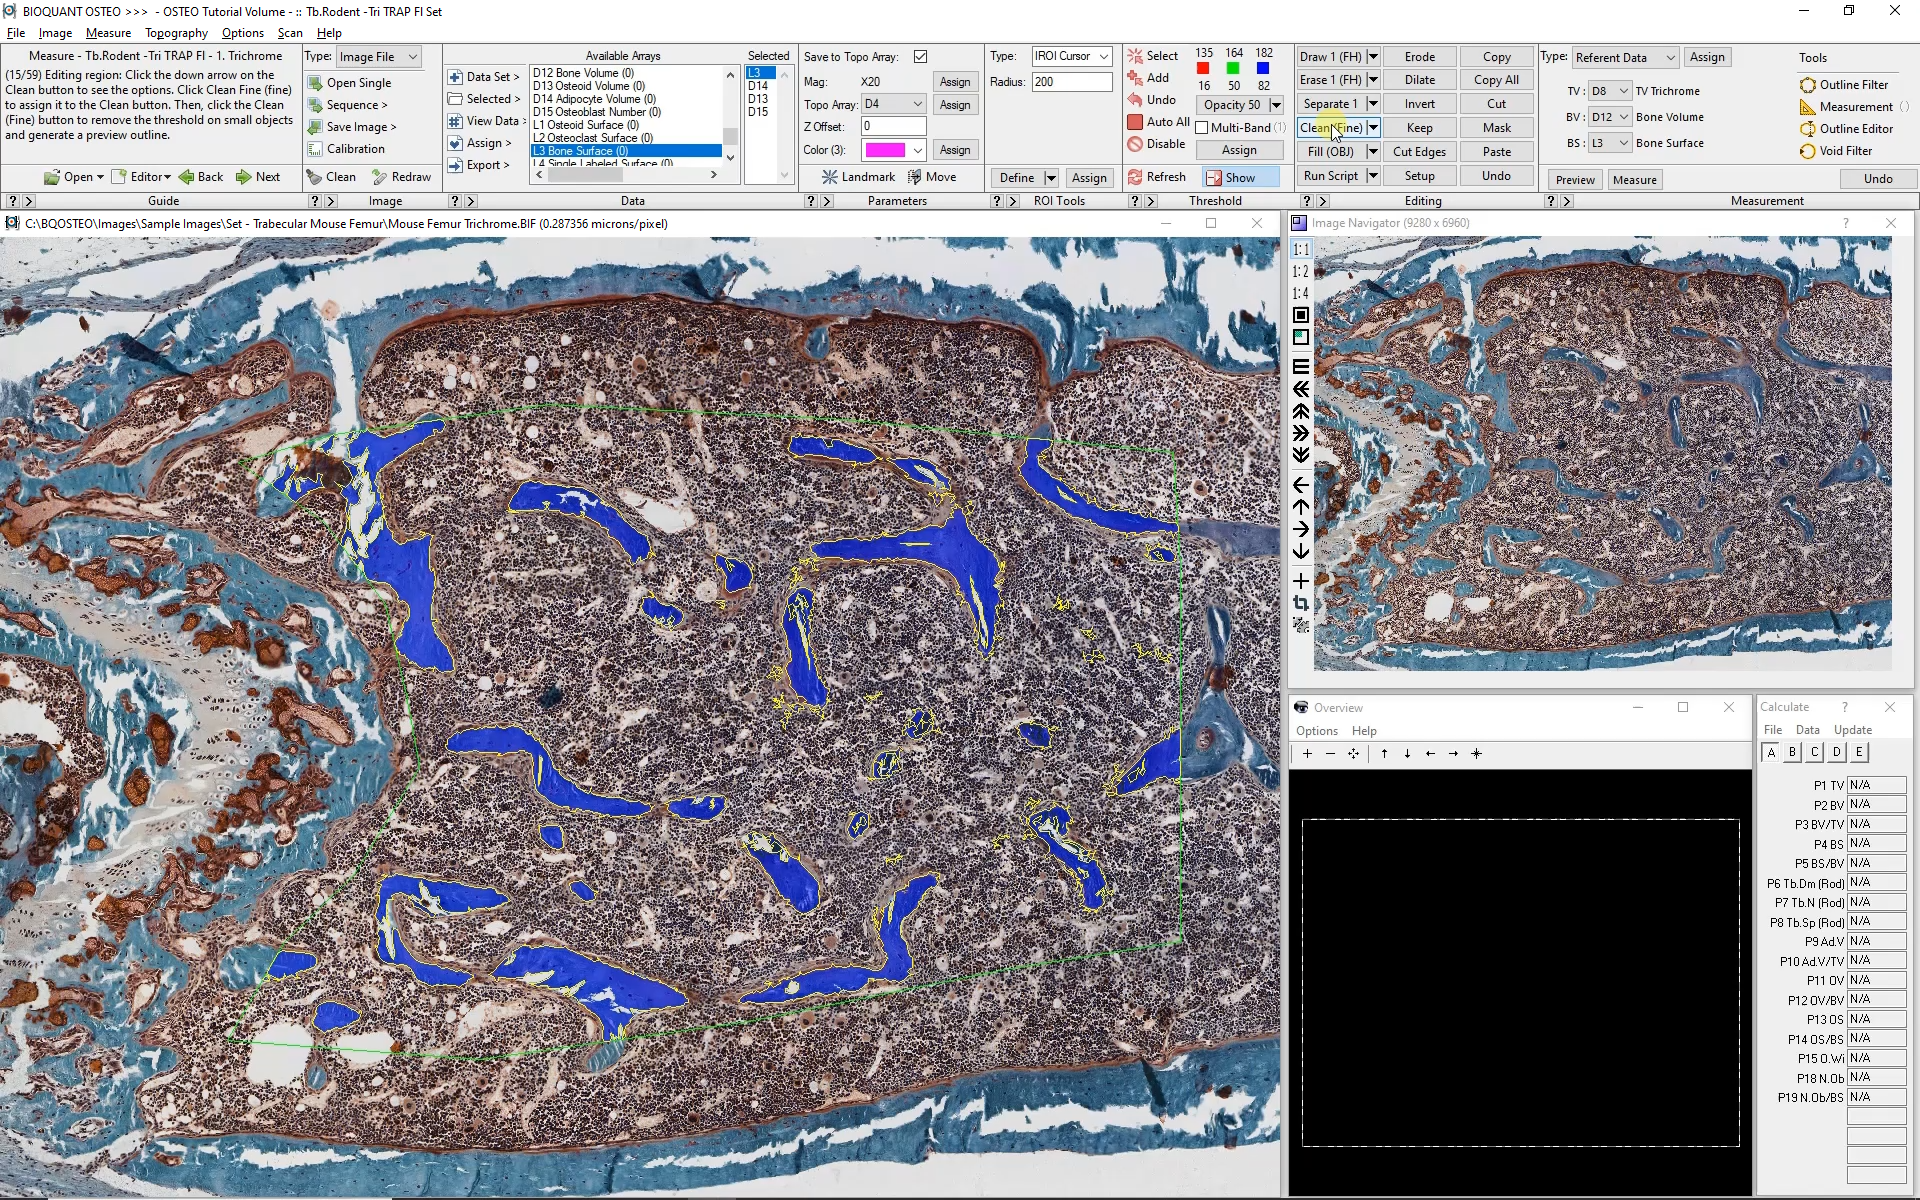
Rapid Threshold Editing
Once a thresholding has been created, BIOQUANT offers simple, fast, and scriptable tools to enhance it. Clean, for example, removes background noise from the threshold be automatically deleting small objects. Erode and Dilate smooth out the surfaces of the bone. Draw and Erase let people make changes directly to the threshold with a brush of adjustable size.
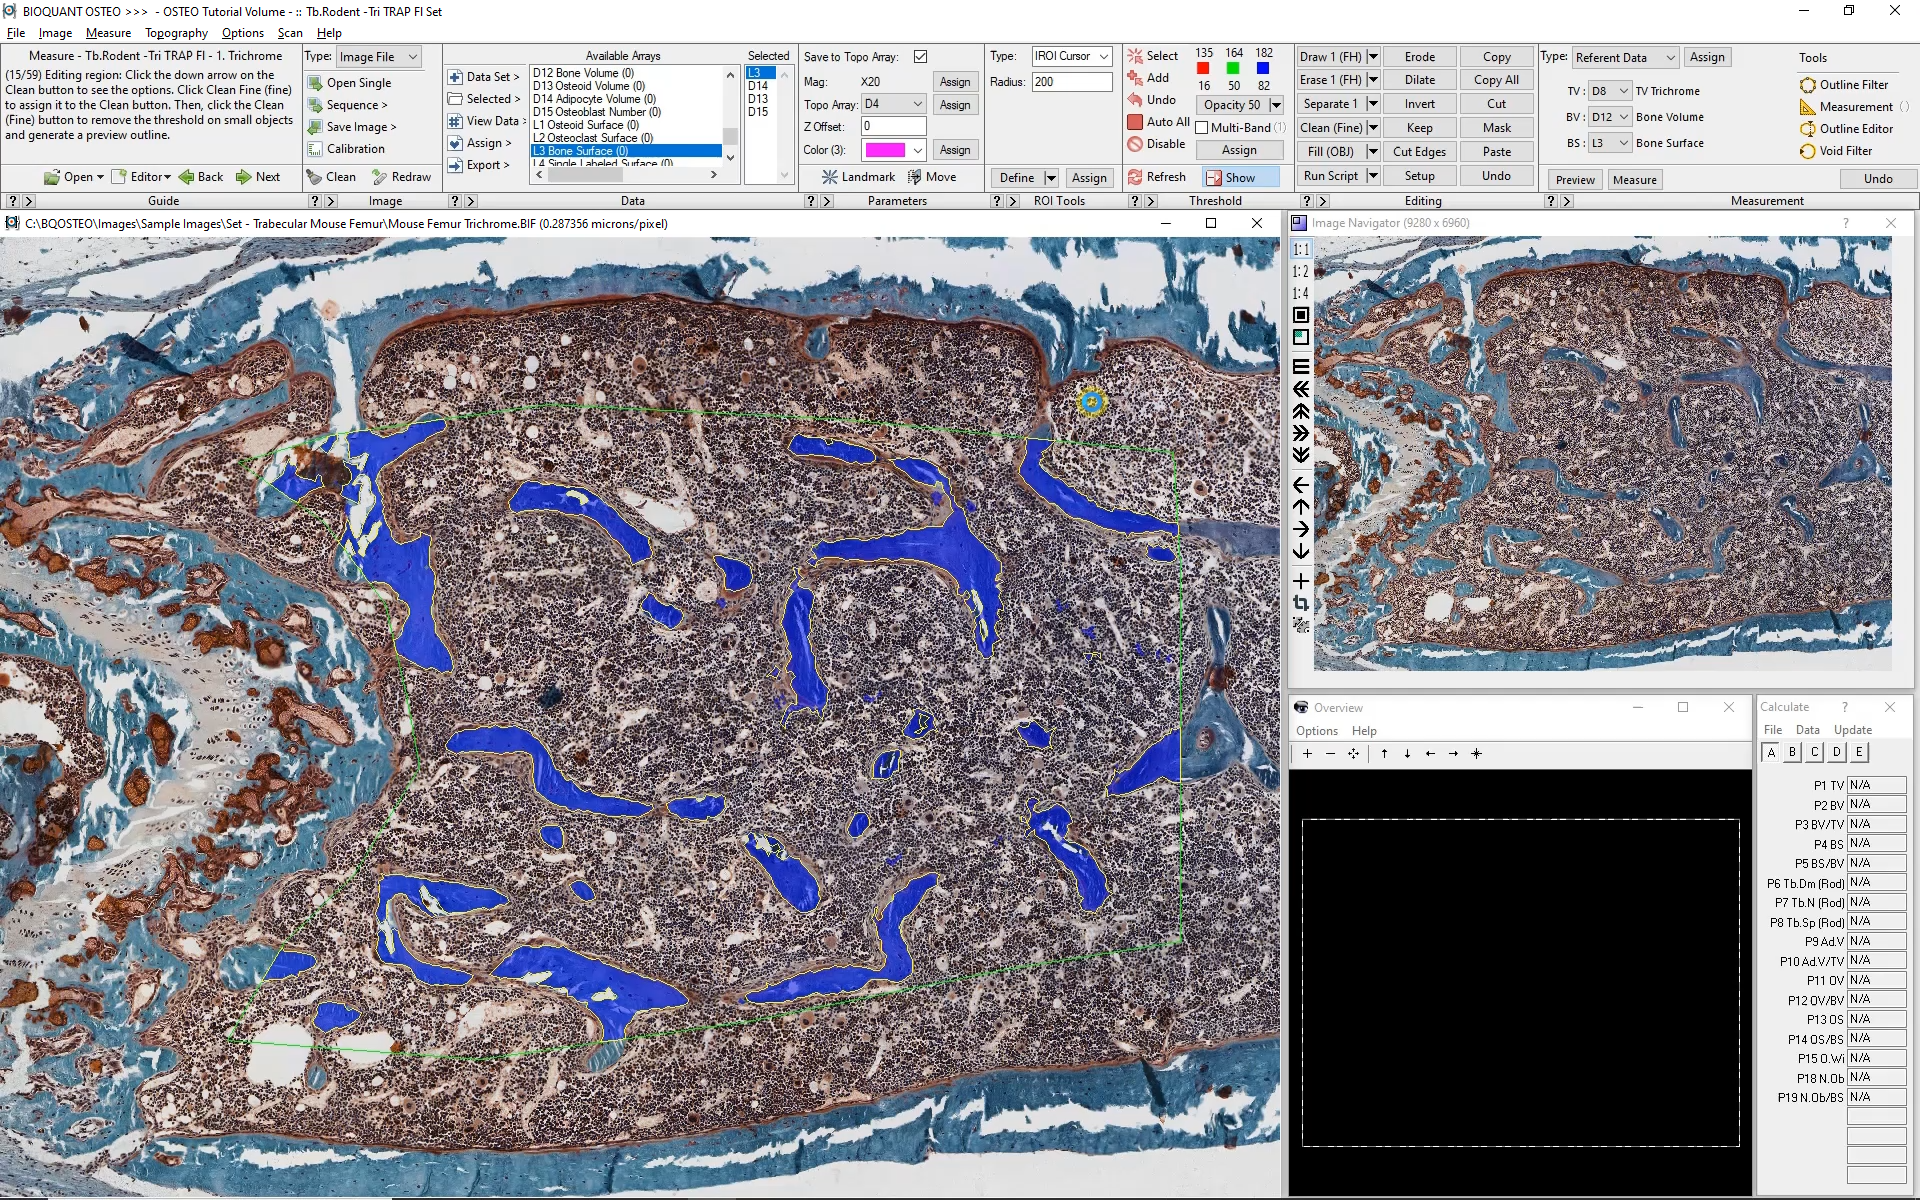
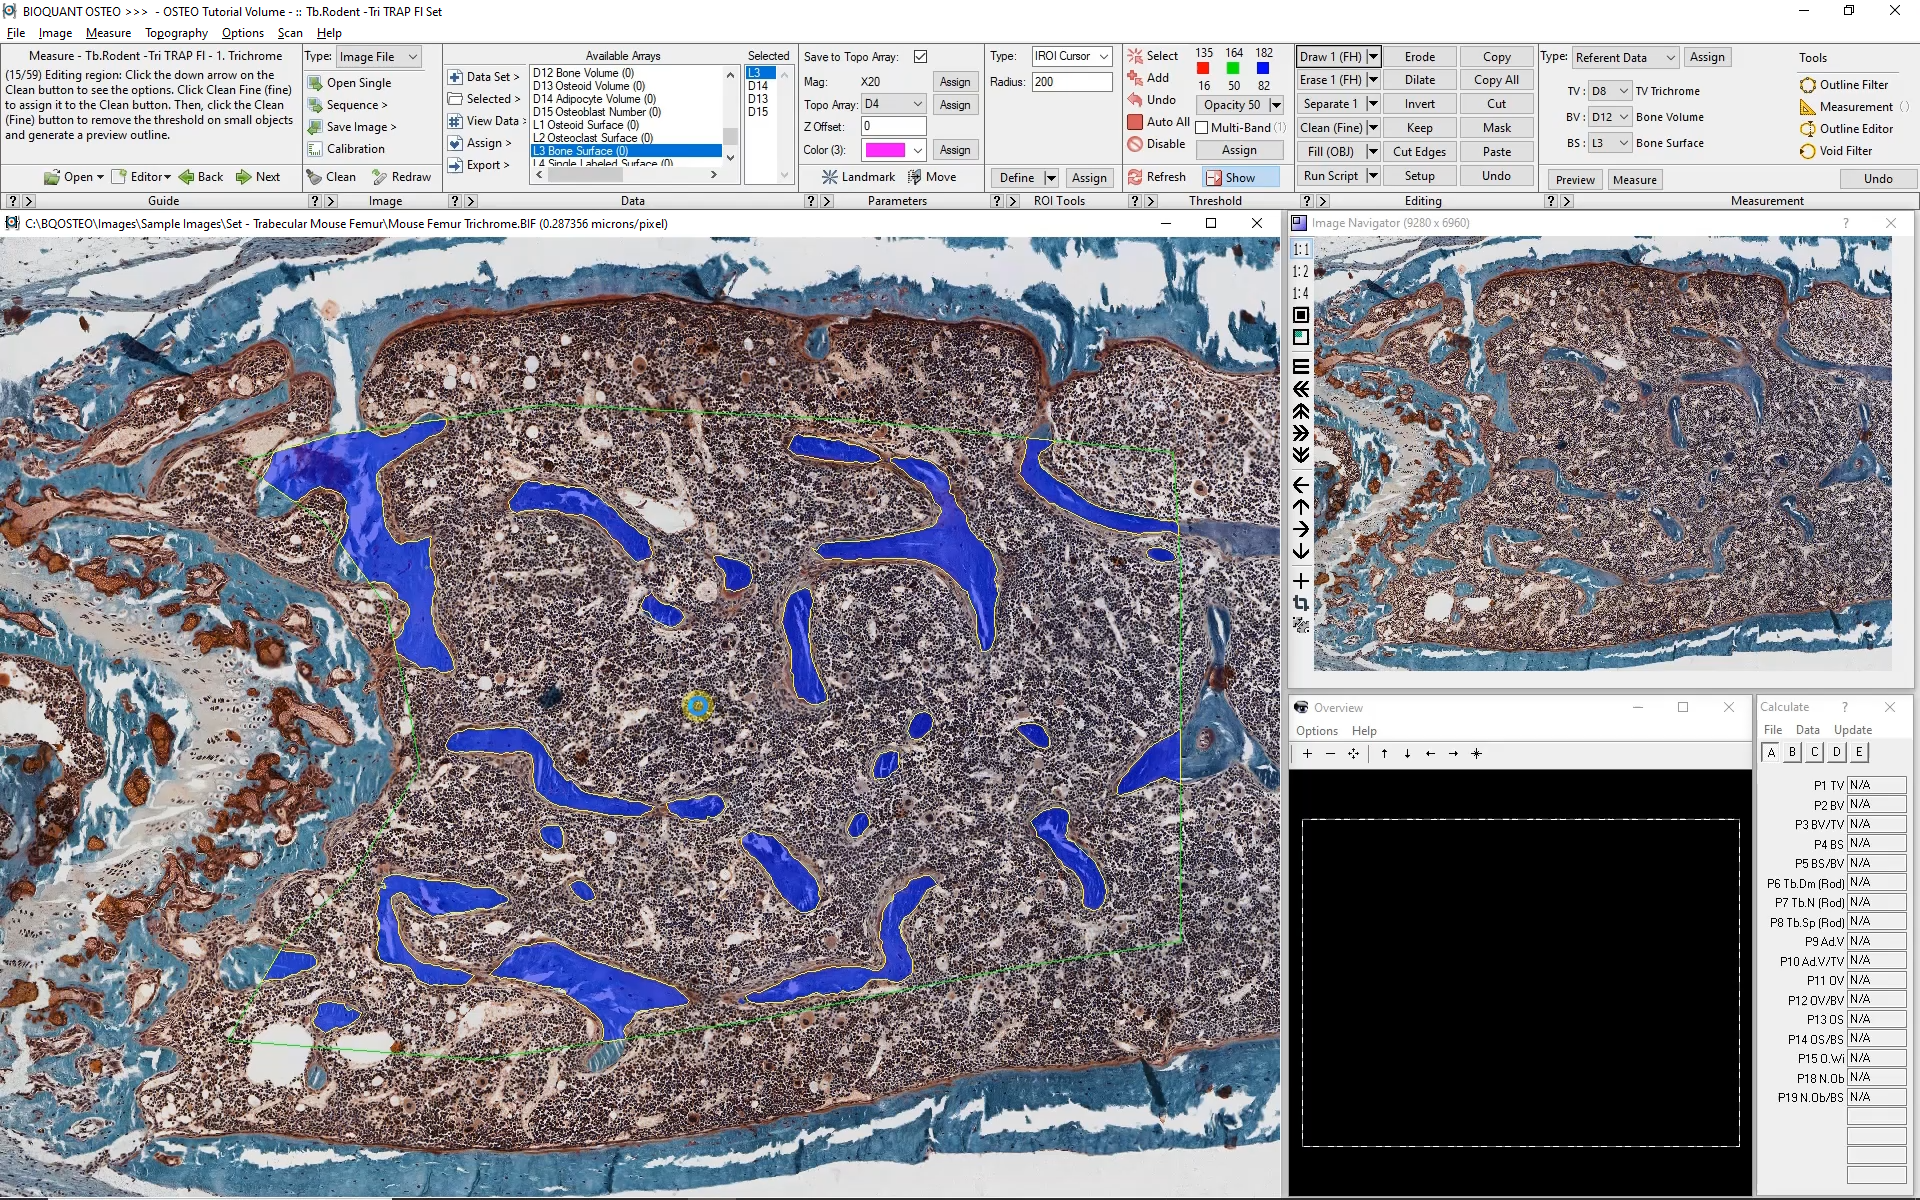
Referent Data
Click image to enlarge.
Referent Data Tool
With the tissue volume and threshold defined, the Referent Data Tool automatically identifies the bone, fills in small holes and cracks, preserves void spaces, and instantly traces the bone. It then collects this data:
TV, BV, BS
BV/TV, BS/BV
Tb.N, Tb.Dm, Tb.Sp
FYI - The Referent Data Tool can be used on a large scan of the tissue, zoomed out to fit in the Image window as show above. It can also be used field-to-field at higher magnification. You do not need a scan or tracking device to use BIOQUANT, although they do save you time.
Adipocyte Data
Click image to enlarge.
Measure Cells
Using the Measure Cells measurement type, BIOQUANT can identify cells by color, size, and shape. Therefore, BIOQUANT can help automate the counting of adipocytes by automatically identifying small, white, round shapes. Additionally, BIOQUANT will automatically skip partial cells that appear at the edge of the field of view. Finally, BIOQUANT will automatically avoid counting the same cell twice, even if it appears again in subsequent overlapping fields of view.
Osteoid Data
Click image to enlarge.
OSTEOID TOOL
BIOQUANT uses the color of the osteoid stain to identify osteoid in the image. A specialized Osteoid tool simultaneously measures the length of the osteoid surface, the area of the osteoid seam, and makes regularly spaced direct measurements of osteoid thickness perpendicular to the osteoid surface. This collects:
OV, Ob.S, O.Wi
OV/BV, Ob.S/BS
Osteoblast Data
Click image to enlarge.
Since specific staining for osteoblasts can be tricky, BIOQUANT usually can't automatically identify osteoblasts. Instead, osteoblasts are identified manually with the threshold paintbrush tool. Once the osteoblasts are marked, BIOQUANT counts and maps them. On overlapping fields of view, osteoblast measurements are redrawn to prevent duplicate measurement. This data is collected:
Ob.N
Ob.N/BS
TRAP Imaging
Click image to enlarge.
TRAP STAINING
TRAP staining is commonly used in rodents because it helps simplify the detection of osteoclasts. Not all cells that express TRAP are osteoclasts, but it's a good place to start.
It's easiest if the TRAP staining is applied to a section which is approximately serial to the trichrome section. This way, the referent data from the trichrome section can be used to normalize the osteoclast data.
Osteoclast Data
Click image to enlarge.
AUTO SURFACE TOOL
Based on TRAP staining, BIOQUANT uses automatic thresholding to identify TRAP positive cells. Minimum size filters help differentiate between TRAP positive monocytes and osteoclasts.
The auto surface tool will directly measure the bone surface occupied by each osteoclast. This makes it possible to collect:
Oc.N, Oc.S
Oc.N/BS, Oc.S/BS
Fluorescent Imaging
Click image to enlarge.
Calcein labeling
Calcein labeling is common for visualizing mineralizing surfaces in rodents. Sometimes it can be combined with alizarine red labeling to differentiate between first and second labels.
It's easiest if the section used for labeled surface measurements is approximately serial to the trichrome section. This way, the referent data from the trichrome section can be used to normalize the labeled surface data.
Bone Formation Rate Data
Single Labeled Surface Data
Click image to enlarge.
Automatic Thresholding
Thresholding tools in BIOQUANT OSTEO allow it to identify bright labeled surfaces. This helps differentiate labeled surfaces from auto-fluorescence.
Auto Surface Tool for Single Labeled Surface
Using the Auto Surface tool, BIOQUANT automatically measures the single labeled surface. Manual editing of the labeled surface is easily done with draw and erase tools. This collects:
sLS
Double Labeled Surface Data
Click image to enlarge.
dls tool
The dLS tool is a manual drawing tool. Each label is traced then BIOQUANT collects:
dLS, Ir.L.Wi
MAR, BFR/BS
Recent Citations of BIOQUANT in Osteoporosis Research
Browse additional citations of BIOQUANT in osteoporosis research.