Cortical Bone Structure
Sectioning & Imaging
Click image to enlarge.
Sectioning
Cross-sections of the diaphysis are usually prepared using a grinding system rather than a microtome. Attempting to cut a cross-section of the diaphysis with a microtome usually causes the section to disintegrate even when resin-embeded. Typically, a 100 micron slab is cut with a saw then mounted on a plastic slide. Then slab is then ground and polished down to a thickness of about 30 microns.
Imaging
Sections may be given a light surface stain. Sections taken from mice are normally imaged with a 20X objective. Section from large animals such as mini-pigs are normally imaged with a 10X objective.
Imaging of the section is generally done in bright field. Fluorescence may be used in cases where labels have been given to the animals as can be the case in studies that use 3-point bending to look at response to mechanical loading. Polarized light may sometimes be used to help visualize the borders of osteons tunneled through lamellar bone.
Referent Data
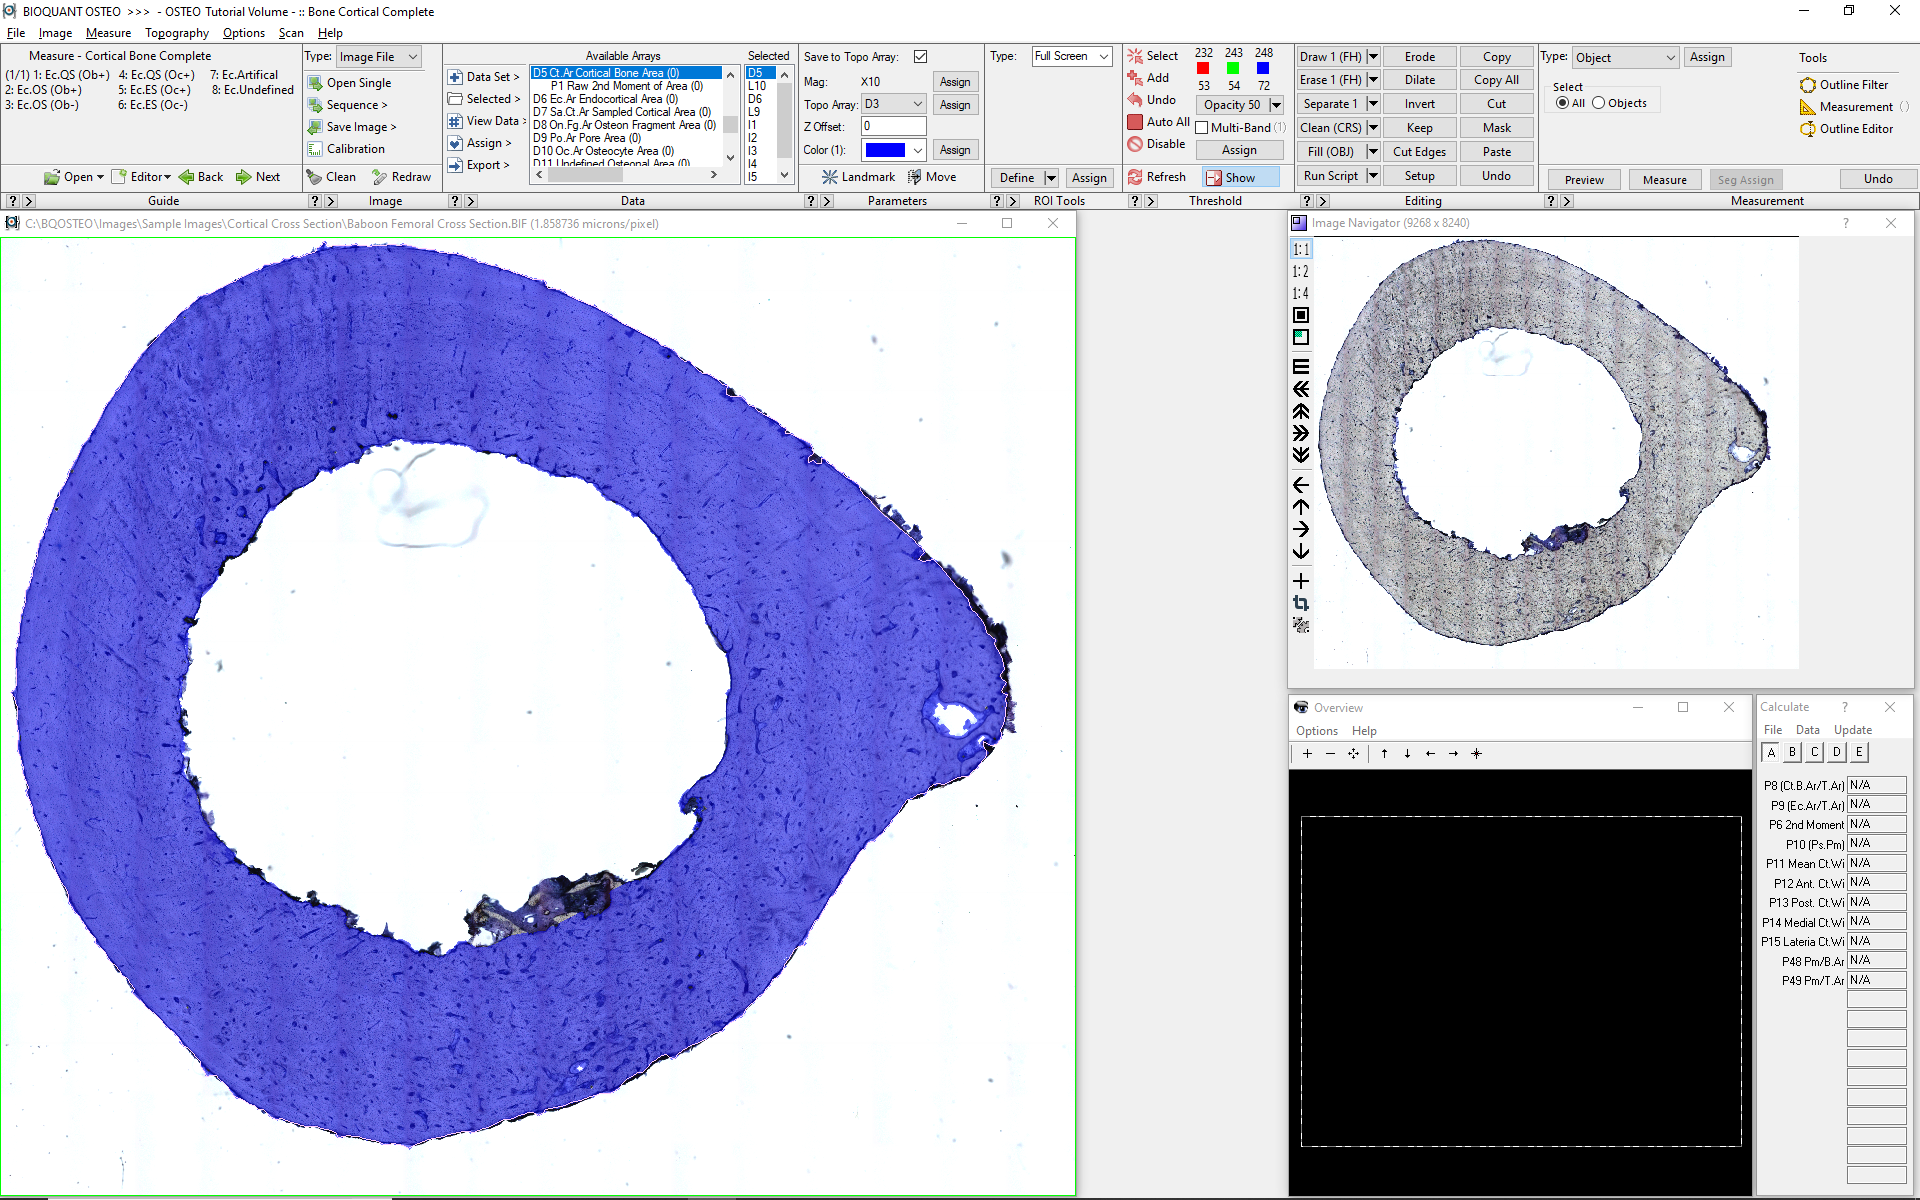
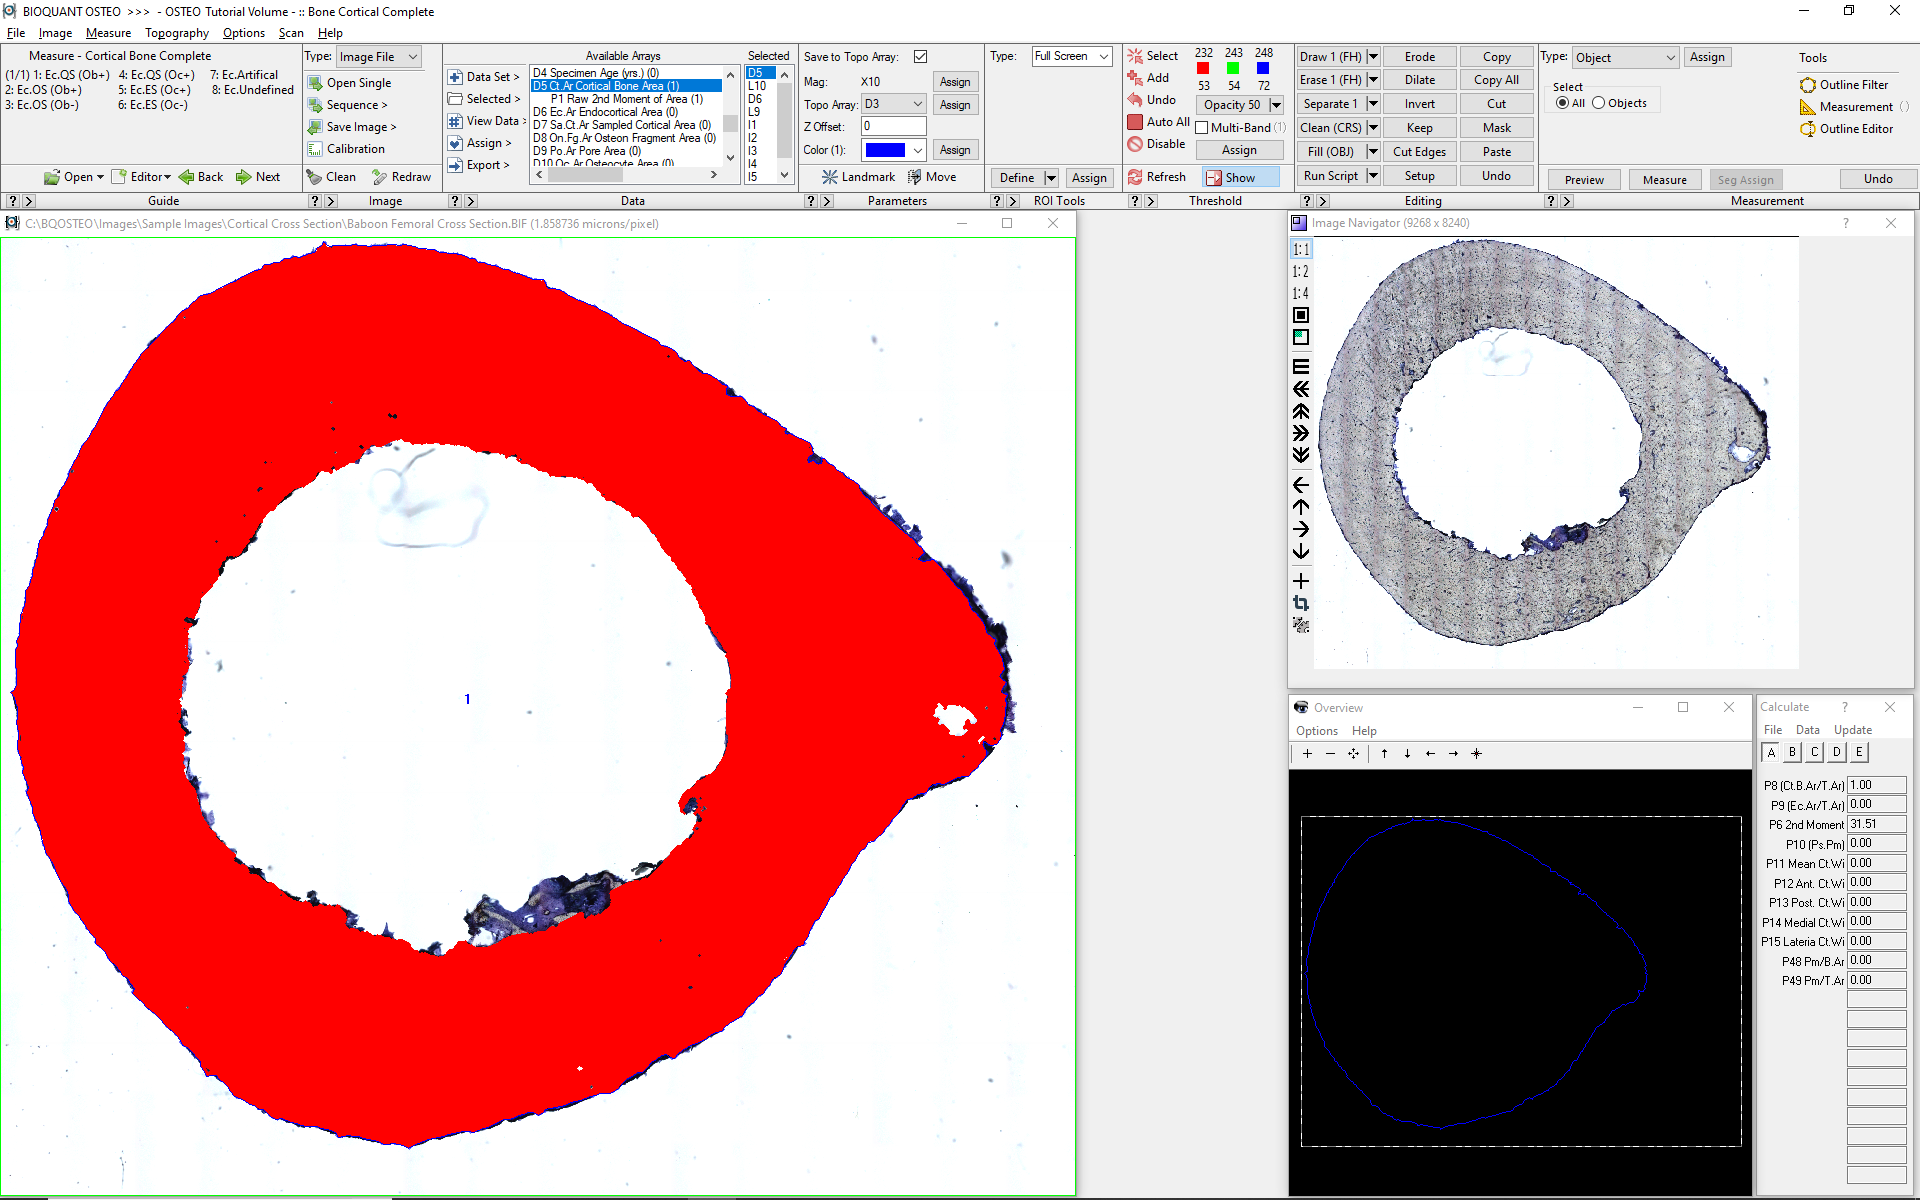
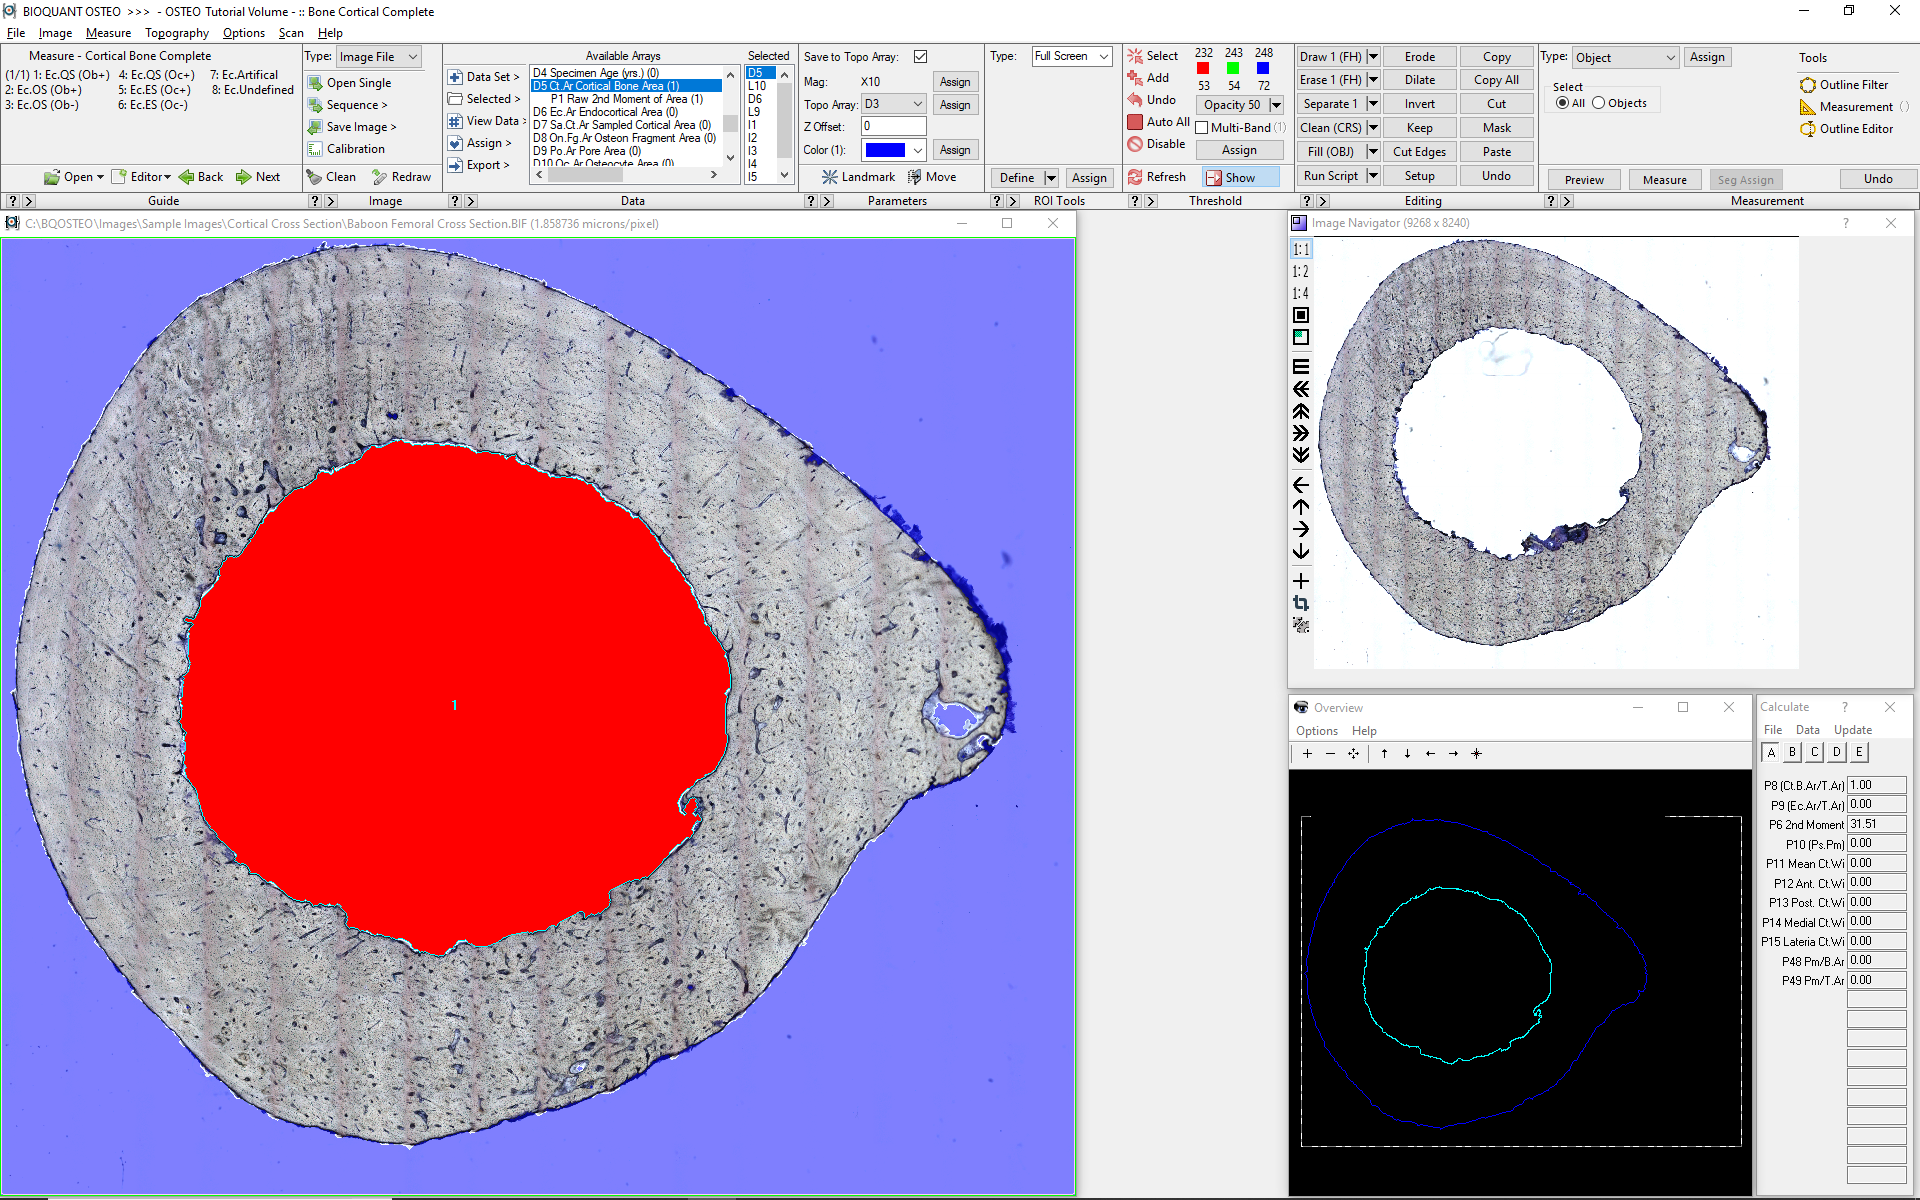

cortical area, thickness, & periosteal surfacE
In this example, a digital scan of the section has been used. BIOQUANT zooms out so the entire cross-section is visible within the field of view. Based on a threshold of the cortical bone, BIOQUANT collects the cortical area, the cortical thickness, and the periosteal surface.
Ct.B.Ar/Tt.Ar
Ec.Ar/Tt.Ar
Mean Ct.Wi
Ps.Pm
FYI - The Referent Data Tool can be used on a large scan of the tissue, zoomed out to fit in the Image window as show above. It can also be used field-to-field at higher magnification. You do not need a scan or tracking device to use BIOQUANT, although they do save you time.
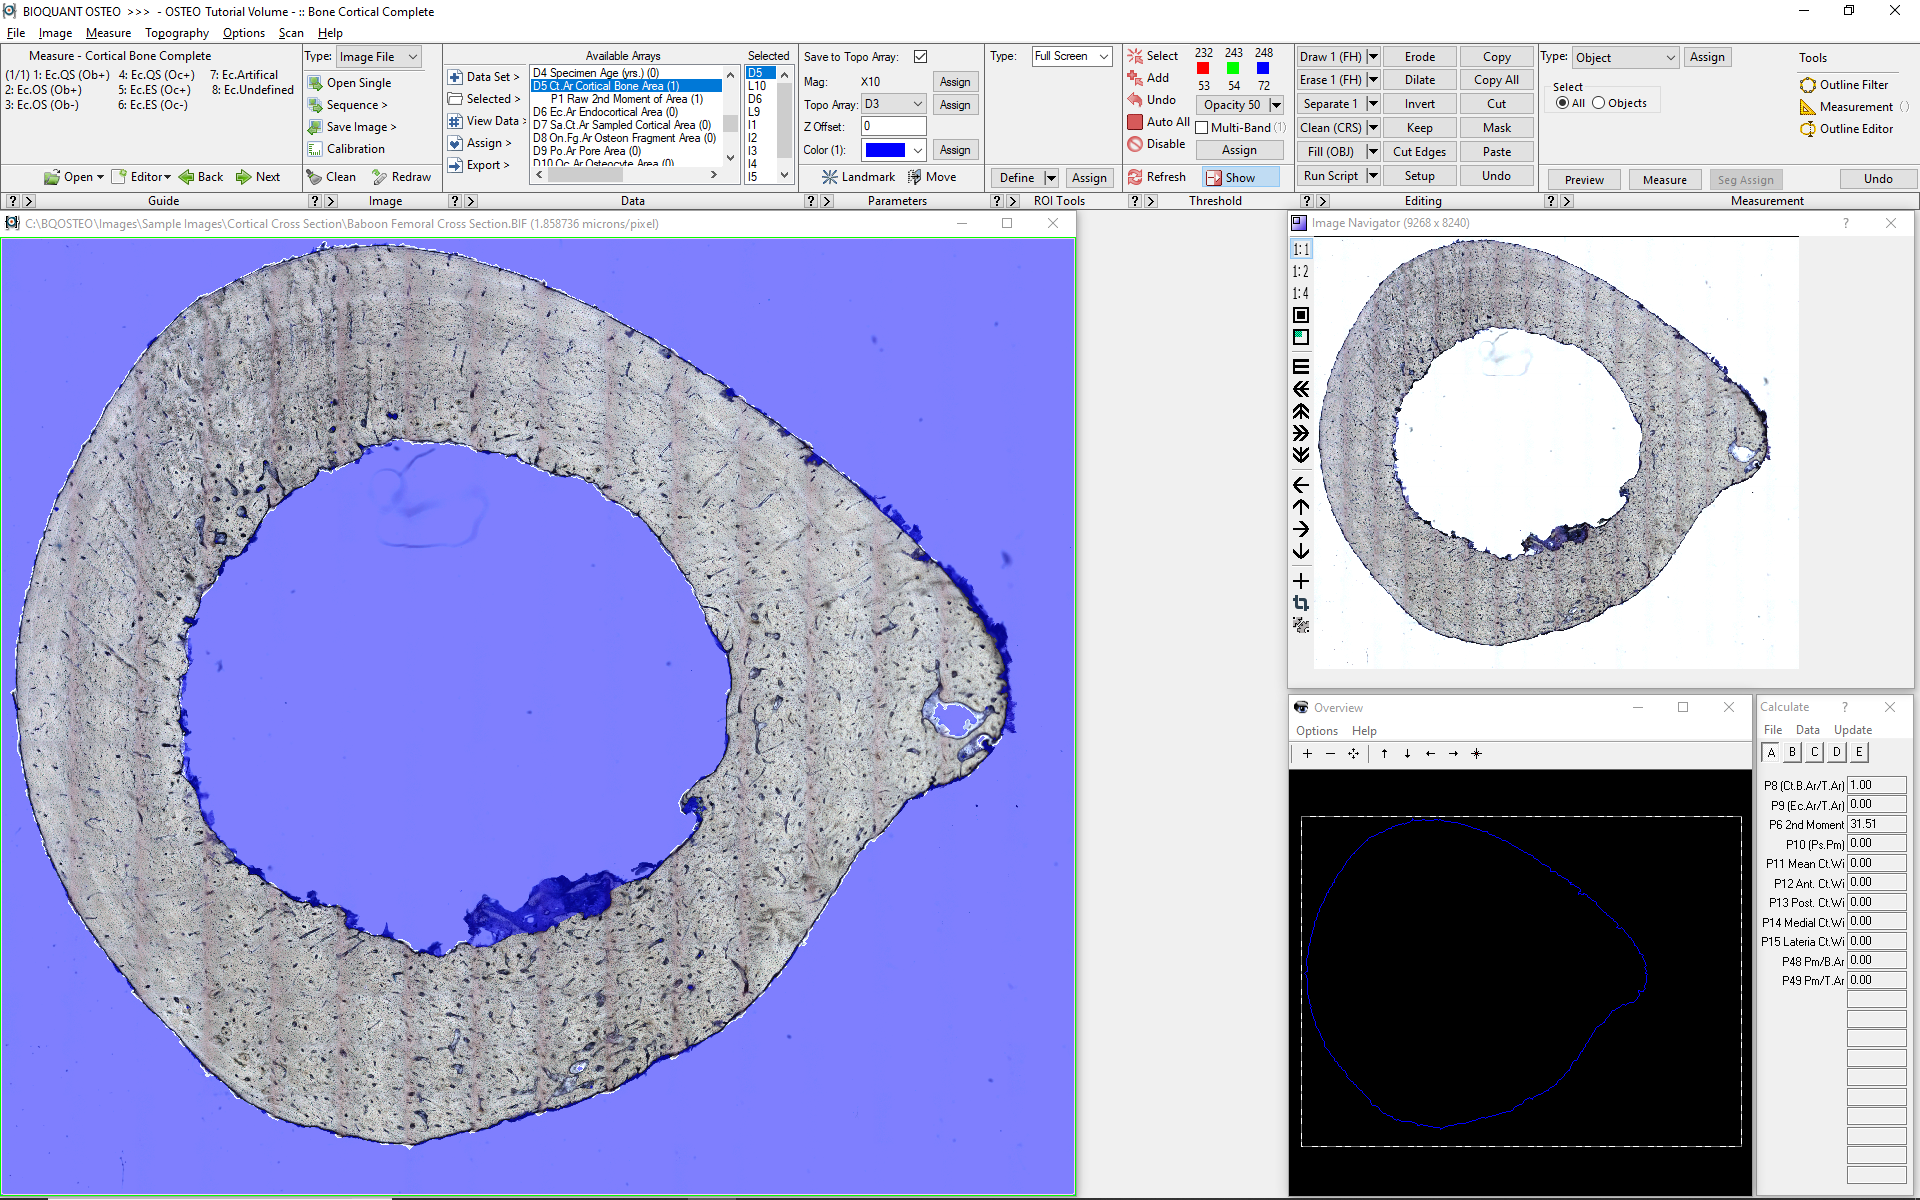
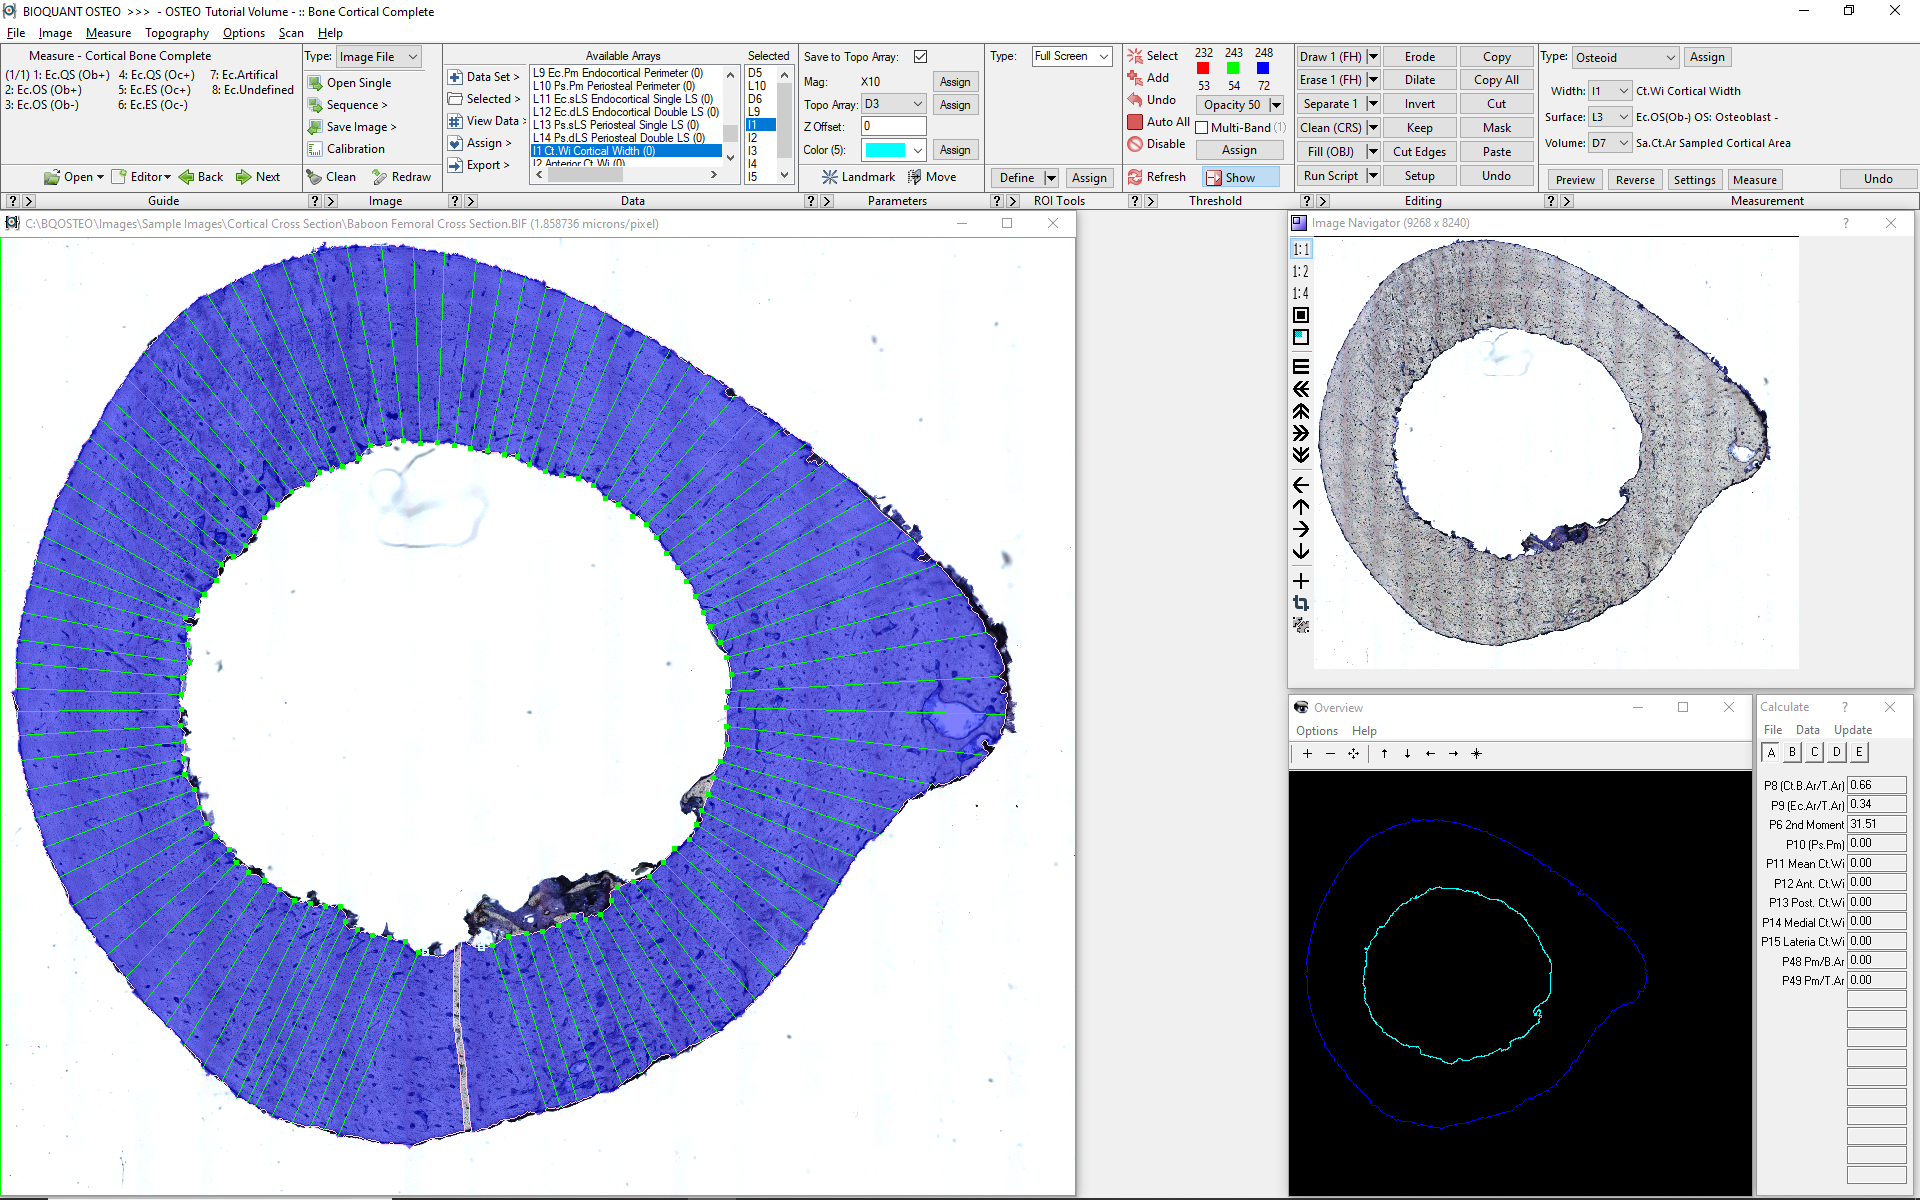
2nd moment of AREA
Relative to the X axis of the image, BIOQUANT also computes the 2nd moment of area for the cross-section. This is a measure of the distribution of cortical bone in section. To be comparable to one another, sections must be images in a consistent anatomical orientation.
Anterior / Posterior / Medial / Lateral Zone Data
Click image to enlarge.
Cortical Thickness along Anatomical Axes
The software provides tools for the direct measurement of cortical thickness at preferred anatomical orientations. Typically, four thickness measurements are made: anterior, posterior, media, and later.
Anterior Ct.Wi
Posterior Ct.Wi
Medial Ct.Wi
Lateral Ct.Wi
Sampling Along Anatomical Axes
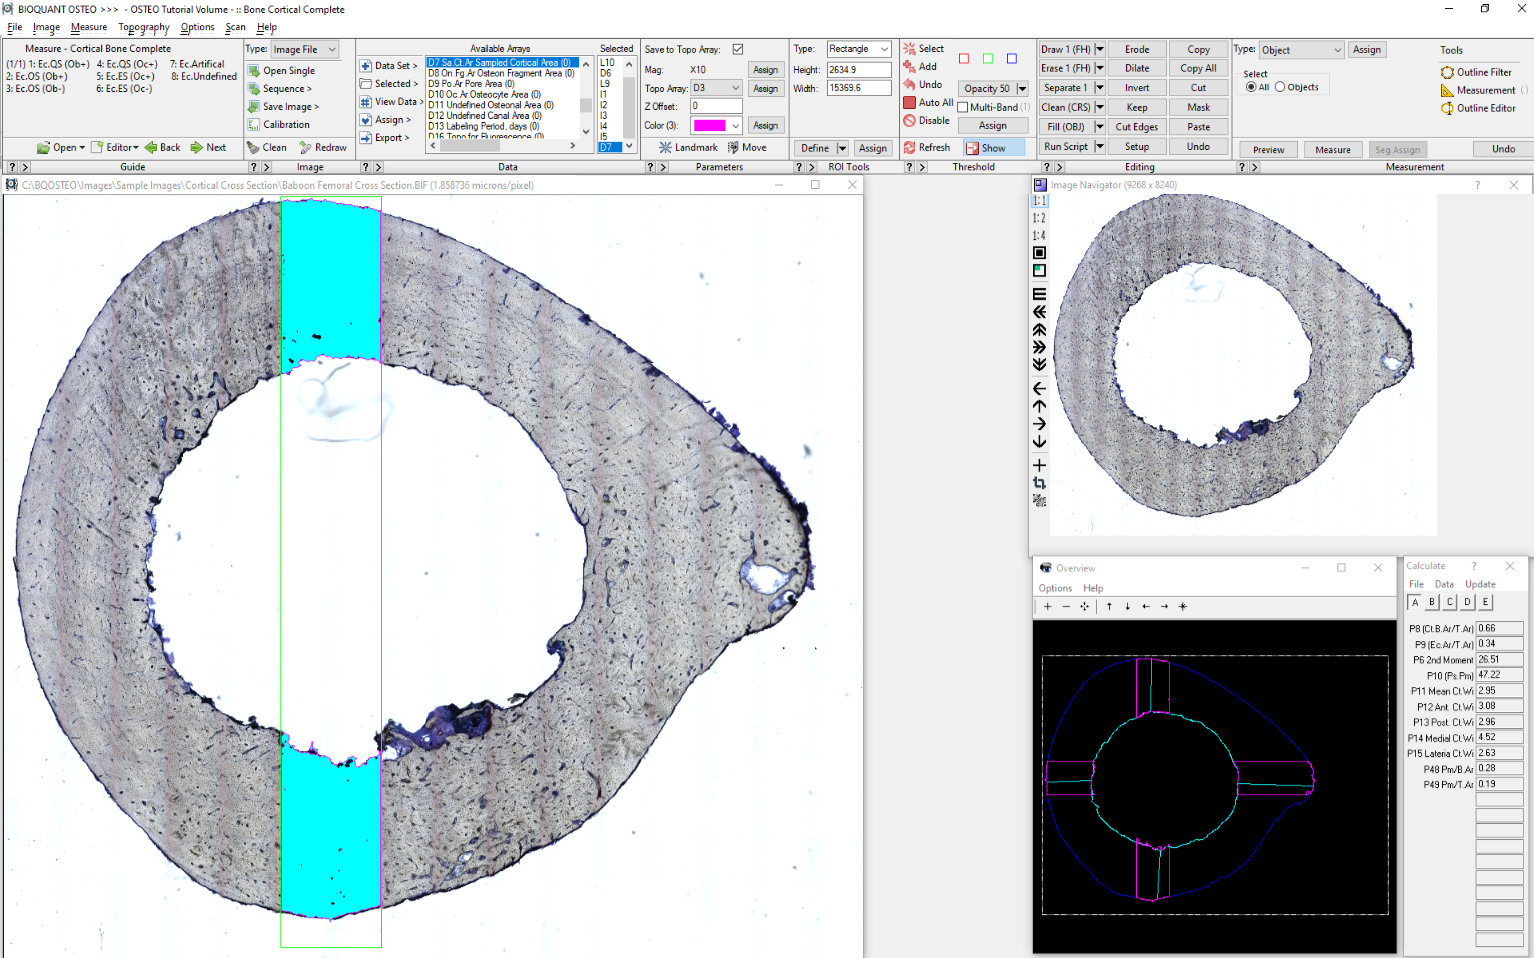
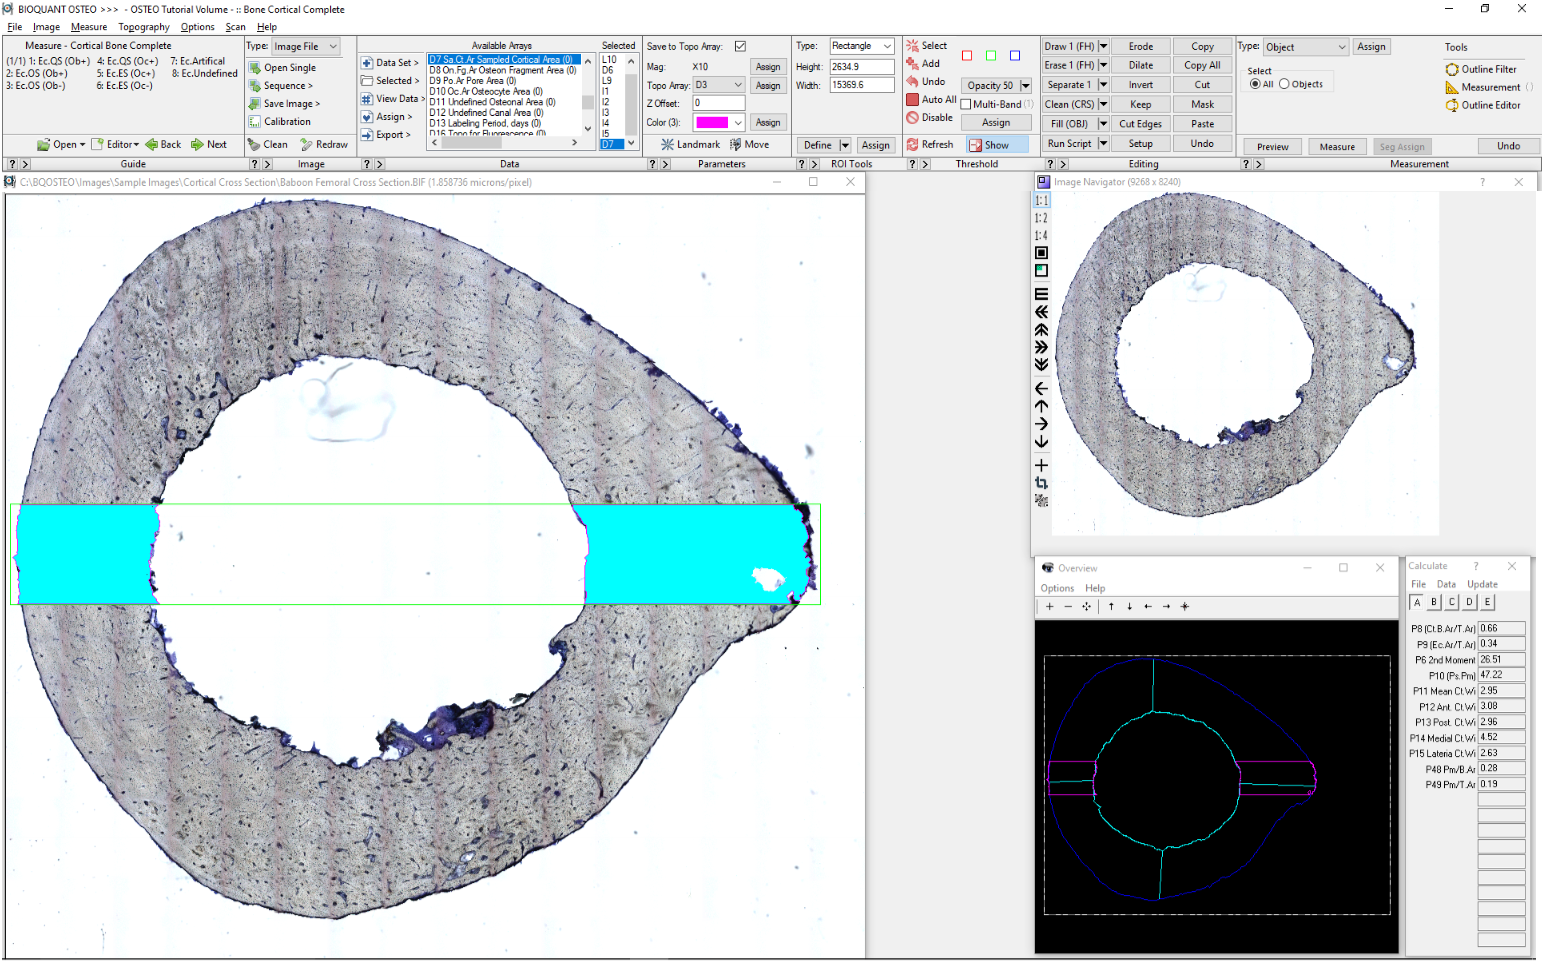
Sampling Areas at the four orientations are defined using a standardized Region of Interest tool that allows strips of standardized shape to be analyzed at higher magnification.
Sa.Ct.Ar Sampled Cortical Area
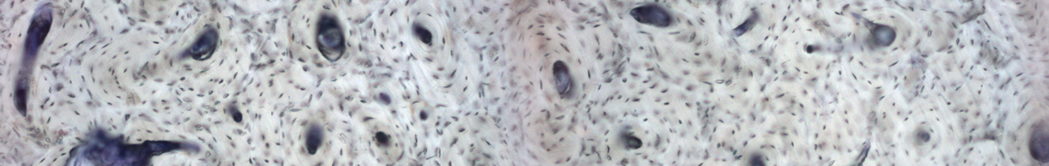
Osteon Data
Click image to enlarge.
Osteon Area / Osteon Perimeter
Since there is no specific staining at the border of an osteon, the boundary is drawn by hand. Once, drawn the boundary is analyzed for both area and perimeter.
On.Ar Osteonal Area
On.Pm Osteonal Perimeter
On.N Osteon Number
OPD Osteon Population Density
Ha.Ar Haversian Canal Area
Ha.Pm Haversian Perimeter
On.Fg.Ar Osteon Fragment Area
On.Fg.N Osteon Fragment Number
On.Ar/Sa.Ar
Ha.Ar/Sa.Ar
On.Fg.Ar/Sa.Ar
Po.Ar Pore Area
Porosity
Click image to enlarge.
Osteon Diameters & Wall Thickness
Similarly, the major and minor diameters of the osteon as well as the wall thickness along the minor diameter of the osteon are manual measurements.
Min.On.Dm Minimum Osteon Diameter
Max. On.Dm Maximum Osteon Diameter
W.Wi Osteon Wall Width
Osteocyte Data
Click image to enlarge.
BIOQUANT automatically counts osteocytes using color, size, and shape to identify them. The Measure Cells tool ensures that no osteocyte is counted twice and that only osteocytes within the sampling area are counted.
Ot.N Osteocyte Number
Ot.N/Sa.Ar
Bone Formation Rate Data
Click image to enlarge.
Auto Surface tool for single labeled surfaces
Using the Auto Surface tool, BIOQUANT automatically measures the single labeled surface. Manual editing of the labeled surface threshold is easily done with the Draw and Erase tools.
sL.Pm Single Labeled Surface
Specialized Double Labeled Surface tool
Pairs of labeled surfaces are traced manually. The dLS tool then automatically measures the interlabel width and the length of the double labeled surface. This data is combined with single labeled surface and bone surface to automatically calculate
dL.Pm Double Labeled Surfae
M.Pm Mineralizing Perimeter
M.Pm/BS
BFR/B.Pm
Citations of BIOQUANT in the Analysis of Cortical Bone
Browse additional citations of BIOQUANT in the analysis of cortical bone.